July 2021 Mid Year Observations
July 2021 Mid Year Observations
July 29, 2021 by Lesjak Planning
It is said that long term secular bull markets in stocks last 15 to 20 years. The previous runs lasted from 1949 to 1966 and from 1982 thru 2000. Of course, these periods were not without interruptions of short-term corrections along the way.
The current bull market started in March of 2009 as suggested by analysts. With the resumption of gains in the indices since correction lows of March 2020, this puts this current run at 12 years. If history does repeat, we can look forward to a number of years left of upward momentum.
Shocks to the markets, such as the most recent talk about inflation and the possibility of the Federal Reserve having to raise interest rates, will cause market volatility from time to time. Any of these shocks will most likely be short term in nature since the equity markets look how the economy is likely to perform in the future which in turn drives corporate revenues and importantly, earnings.
Even though there are substantial job openings that continue to go unfilled is constraining the economic recovery from the Covid 19 lockdowns, we are seeing impressive growth nonetheless. Revenues, especially in areas most affected by the lockdowns such as travel, entertainment, and restaurants, have rebounded nicely as consumers return to normal spending habits.
As the additional government stimulus/unemployment benefits end in the near future, we can expect more job openings to be filled by those looking for work.
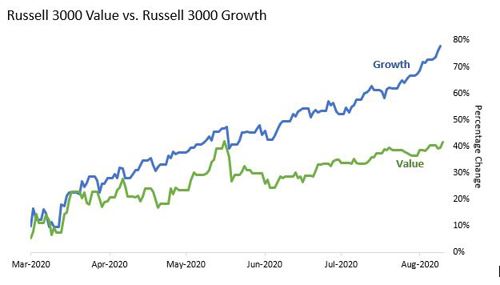
The markets so far this year have been in what is called “sector rotation” which basically means that money has been moving from sector to sector versus all going either in or out of stocks altogether. The sectors that led the gains last year were mostly comprised of growth and technology stocks that benefitted from the “stay at home” mandate and provided technology and service to those affected. Small companies also benefitted from the low interest rate environment since they tend to be net borrowers of capital to fund research and development.
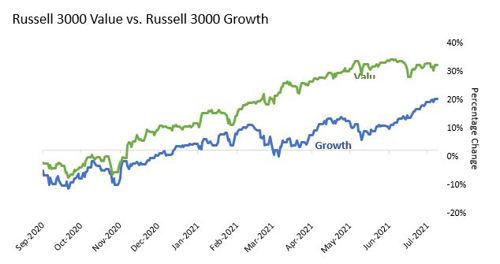
Early on this year though, as the Covid vaccines became available and lockdowns were lifted, the more value styled sectors which include stocks in the leisure, travel, and entertainment sectors took over the lead in a big way (Please refer to accompanying graphs). Oil and commodity prices started rising in the spring after long droughts which caused talk of unexpected inflation and rising interest rates which then caused money to flow from the interest sensitive technology and growth funds to more inflation protected sectors such as real estate, precious metals, and commodities. These sector rotations can take some of the froth out of overvalued markets instead of the overall markets experiencing major corrections.
MMT is a big departure from the conventional economic theory that deficits are bad both in budgeting and ongoing deficits on financial statements. It proposes that governments that control their own currency can spend freely, since they can always print more money to pay off debts in their own currency.
The theory suggests government spending can grow the economy to its full capacity, enrich the private sector, eliminate unemployment, and finance major programs such as universal health care, free college tuition and green energy. MMT proponents argue that governments can control inflation by spending less or withdrawing money from the economy through increased taxes. Thereby eliminating the need to raise interest rates.
Traditional economists have some issues with this theory. Their contention is that every country that has taken this approach eventually collapsed.
In closing, there are unknowns in both the economy and politics that can affect how markets interpret and react to those unknowns going forward. No one can know how exactly these issues will unfold so we continue to believe that a diversified allocation of assets across available sectors which individually respond to opportunities presented is the best course to help reduce risk while also positioning to profit from those opportunities.
The ability to find quality investments and managers and to position assets proportionately to meet investment and life goals remains our priority.
There will be periods where investor’s sentiment and expectations become too bullish which raises market valuations to extreme levels with no new money available to be invested
Although we still may have years left to run in this bull market, there will be periods where investor’s sentiment and expectations become too bullish which raises market valuations to extreme levels with no new money available to be invested. Currently, “Fund flows” which is money that is going into mutual funds and exchange-traded funds is near record levels. Flows into global stocks for the first six months of 2021 are the most in four decades. Commodity prices have increased the first half this year, the most in five decades. So as for stocks, bonds, and commodities, investors are all in at this point.
With the gains experienced so far this year, we may experience some periods of market stagnation since many investors and traders have taken long awaited vacations. Sector rotation may continue as corporate earnings are announced next week and money flows to those that do well.
Times such as we are in now can hurt portfolios if greed takes you in a direction that strays from your long-term allocation goals. Short term trading that newer, smaller online brokerage firms are pushing is akin to Vegas style gambling which will end badly for many that follow. These are opportune times to verify risk levels and allocation.
No review can be written without mentioning inflation and its effect on the cost of all goods consumed and also on economic growth. There is no doubt that prices for most goods have risen compared to a year ago or even two years ago pre-pandemic. Prices of gasoline, food, and especially all building materials have skyrocketed due to both demand and scarcity of product. The Federal Reserve has stated that this is a short-term occurrence since the current rate is being compared to last year as consumption was low due to the virus lockdowns. They think it is temporary – maybe it’s not.
Inflation is defined as “too much money chasing too few goods”. We know that the production of goods is currently lagging demand. As far as the money – the “M1” money supply – which is coins, currency in circulation plus checking, savings and money market accounts, are up over 300% since the end of 2019. This is unprecedented.
Then there is the government printing and spending money at record paces. Since the start of Covid 19 pandemic, the Fed has committed to printing more than $6 Trillion to support its stimulus programs. This is three times the money spent on bailing out the economy in the last crisis.
We may be reaching the inflation tipping point. And the government’s only way to fight inflation is by raising interest rates or raising taxes.
A change in the economics of the past is the more widely based acceptance of “MMT” or Modern Monetary Theory. This theory became more popular during the Presidential primaries in 2016.


About the author
Lesjak Planning