Don’t Follow the Money
Don’t Follow the Money
August 27, 2008 by Lesjak Planning
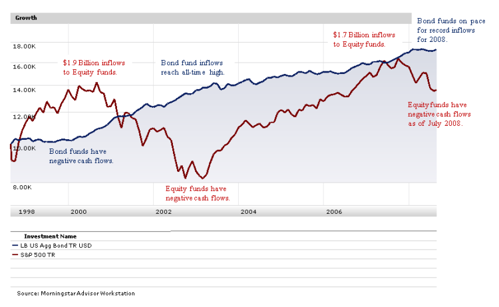
Recently, our research into stock and bond markets’ performance with respect to mutual fund cash flows produced some interesting results we thought to share with you. Simply put, mutual fund inflows are when people buy the funds and conversely, outflows are when people sell. The accompanying chart is a 10 year graph of the S&P 500 Index and Lehman Brothers Aggregate Bond Index through the end of July 2008.
To summarize, when equities reached new highs most people were buying and when equities were at a bottom most people were selling. The reason for such dramatic shifts in where the money goes is Fear and Greed. Whether the average investor gets greedy near the top or afraid of the possibility the market will not rebound from its declines. The best protection from getting caught in the “buy high, sell low” cycle is having a long-term plan, a diversified portfolio, and understanding how the markets work.
Certainly, there is no guarantee of the future performance in the markets. However, if history is any indication, the next several years appear more promising than the past several months.
Sources: Morningstar Advisor Workstation, Mutual Fund Database 2008. Investment Company Institute Database 2008.
Let us go through the graph chronologically to gain some insight into the relationship between the stock and bond markets with mutual fund cash flows.
Obviously, the S&P 500 Index increased substantially until it reached its peak in 2000 while the bond index remained relatively flat. At the peak for the stock markets, monies flowing into equity funds reached an all-time high of $1.9 billion and the bond funds actually had negative cash flows.
The stock markets then declined for the next 2 ½ years while bonds enjoyed significant growth. In 2002, the equity markets reached their bottom which coincided with negative cash flows for the first time since 1988. At the same time, bond funds had the highest rate of net inflows on record. Are we sensing a pattern here?
The S&P 500 Index reached new highs in 2007 which once again coincided with substantially high inflows of $1.7 billion (second most ever). However, through July of 2008 equity funds have negative cash flows while the bond funds are on pace to set a new record for net inflows.


About the author
Lesjak Planning