Happy New Year 2017
Happy New Year 2017
December 28, 2016 by Lesjak Planning
We would like to take this opportunity to wish you a safe, healthy, and prosperous New Year and to recognize and appreciate the relationship that we have with you. Your family’s well-being and financial progress is the cornerstone of our commitment, which we take very seriously. Change has been a constant during our time together and if there’s one guarantee we can make, it is that the future will continue to evolve both here at home and also worldwide in ways we have yet to imagine. It is this change that we find so exciting, as a challenge to stay on the cutting edge of strategy, technology, and service.
We enter this New Year with new projects as a firm to continue to stay at the forefront of our profession. The sometimes mind boggling advancement of technology is useful to help us get information to you in times of chaos and also in our regular account reporting. Regular e-mail blasts help keep you current on our perspective throughout the year as world events cause volatility in all markets.
If you enjoy volatility, you were not disappointed this year. Virtually every possible investment sector experienced a substantial period of decline or gain over the past twelve months. Large and small company stocks, emerging market and international stocks, oil, gold, silver, real estate, wheat, corn, and the list goes on. They all had their time in the sun and clouds. And no one accurately predicted or acted upon the majority of them.
The time frame that is used to determine if an investment is profitable or not has grown so short, and advice is here today and forgotten tomorrow that it becomes impossible for the average investor to have a fair chance at success. As stated above, there is just too much daily movements in markets and unpredictable human behavior to be certain of any short term prediction.
There are far too many variables and surprise outcomes to try and make significant investment decisions based on short-term singular events. Human nature – fear and greed – have, and always will cause ill-advised decisions which will continue to add volatility to all markets.
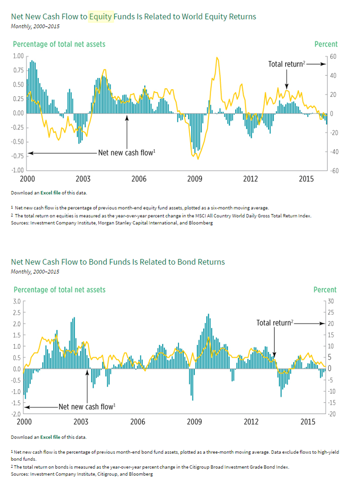
In past decades we have asserted that the emotions of investors cause contradictory investment decisions during times of market stress or exuberance. Graphs from the most recent 15 years support the fact that cash flow into equity funds normally increases after market rebounds to new highs and money flows out of equities after prices decline. Flows into and out of bonds in relation to returns support the same decisions. (See the attached graphs).
Data from the market decline of 2001-2002 shows that investors still plowed a record net $315 billion into new equity funds in the year 2000 after a 10 year spectacular run to new highs. Bond funds had net redemptions of $50 billion for the same period. After the market’s sharp selloff in 2001, net investments into equity funds dropped to $33 billion in 2001 and net redemptions of $29 billion in 2002. For the same period again, net inflows to bond funds totaled $88 billion and $141 billion respectively. After the market rebounded, new investments to equities resumed the higher that stock prices went. Wrong investments at the wrong times.
The decline during the great recession of 2008 was similar but more dramatic. In 2008, net redemptions from equity funds totaled $215 billion while bond funds had net inflows of $30 billion. 2009 and 2010 had equity inflows of $2 billion and an outflow of $24 billion respectively. Bond funds for the same period experienced net inflows of $371 billion and $232 billion. This flight to safety continued in 2011 and 2012. Meanwhile, the Dow Industrial Average rebounded from its low of 6,507 in early 2009 to its current value touching nearly 20,000. After major declines, equity markets have rebounded to new highs 100% of the time.
In addition to emotions; advertising, misleading statistics, and sales practices also lead investors to make questionable decisions. Reversion to the Mean is a term which is defined as the theory suggesting that prices and returns eventually move back toward the mean or average.
We experience Reversion to the Mean in all sectors of investing. During the 1980’s through the 1990’s, equity returns greatly outpaced bond fund returns. Since 2001, bond funds have outpaced stocks on a general basis. It now looks to us that bonds will again underperform stocks in the future as interest rates increase back to normal ranges. Value style stocks and funds have periods of outperforming Growth style stocks and funds. After each of these periods, the other reverts back to the mean and outperforms so that over very long periods, the performances are about equal (the problem with this is that one never knows when this reversion begins).
An example of this currently is being noted in the financial press. In short, it is the movement of assets from actively managed funds over to passively managed funds that are invested to follow a market index. As of September 30th, actively managed mutual funds had outflows of $304 billion over the past 12 months while passively managed funds brought in $437 billion. When equity markets have ample cash on the sidelines and prices generally are on the rise, passive funds will outperform the average actively managed fund. Note the reference to the term “average” managed fund.
Current mutual fund databases list over 8,000 equity funds and obviously half of those have below average performance and half are above average. It would be silly and not prudent for an investment advisor to continuously use average or below average performing fund managers when there are fully half of all funds that are above average in performance. Since the passively managed index funds have a lower expense cost due to no manager fees and no distribution costs, it is imperative to include the higher costs of any actively managed fund in any comparison.
If you assume that an investment advisor has no commission conflicts of interest and has the desire to search out the active investment managers that, say, fall in the top 10% of all the active managed funds, then the passively managed index scenario should hardly be competitive.
As an actual example, if we compare three actively managed funds (all large capitalization funds similar to the S&P 500 index) that are in the top of their categories, they have achieved the following results. Over each 10 year rolling return since 1999 (173 monthly periods), one fund outperformed the S&P 96% of the time, the other 86% of the time and the 3rd 84% of the time.
We believe that investors have again made a mistake by moving away from actively managed funds in a time when they are poised to again outperform and revert to the mean. Many active managers in the top percentage have been stymied by artificial environments which the central bankers, including our own Federal Reserve Board, have created by keeping interest rates low for so long. We think that is about to change as we move from an interest rate driven market to an earnings driven market.
So, if we as investors can avoid the temptation to buy or sell positions and securities based on the prognostications of short term thinking pundits, regarding situations in which no one can be absolutely sure of the outcome, where do we stand going forward?
We are of the opinion that instead of having a major decline in equities across the board, the Federal Reserve, by keeping rates so low, kept many companies in business and allowed others to buy back shares and continue to pay dividends by borrowing money. The large loan balances that have accrued during the past few years supports this. This likely has caused a stagnation or internal correction that happened over the past two years and kept equity returns near zero.
If tax rates decline and regulations are reduced in the future for business, this theoretically will spur new business formation and increase net revenues after taxes. As investors, this should be good for stock prices into the future.
Happy New Year! The best is yet to come.
The Lesjak Planning Team
Dave, Mike, Marc, Nathan, Kevin, Kathy, and Jessica
Two instances this year support that statement.
England was to take a vote whether to leave or stay in the European Union of countries. Markets and pollsters in the weeks prior flip-flopped consistently on the odds of England voting to leave (Brexit). Upon voting day, polls and the markets suggested by a substantial margin that the vote would be to stay. For if they voted to leave, they said, Europe’s economy would implode and markets and trade would be severely harmed. The vote was taken and the result was to leave the union. Initially, shock and chaos hit the media and the markets. After a week of cooler heads prevailing, markets rebounded, economies survived, and the trade continued. False alarm.
The second instance was more recent in this country. As our presidential election neared after a historically brutal campaign season, weekly polls were consistent that the likely voter would by a wide margin elect one candidate over the other. On the financial front, the experts were eluding to the fact that since the stock market was behaving well during the historically troubled month of October, that it was a sign that investors were convinced that the polls were correct. They went on to comment that if the underdog candidate were to win, that markets would react very negatively and very possibly crash.
The underdog won. After one day of market volatility, stock prices had their best one week performance in history and have continued to new highs. The pollsters and experts were wrong. False alarm.


About the author
Lesjak Planning